
 This online help page is dedicated to the SurgeONE.ai Dashboard screen and its associated functionalities.
The accessibility and functionalities of the different sections of the SurgeONE.ai Dashboard, as well as its visibility, are dependant on the role based access controls / permissions set for the logged-in user. For more details refer to the Roles online help.
1. SurgeONE.ai Dashboard
The SurgeONE.ai Dashboard offers real-time data visualization and analytics with a centralized and real-time overview of all audit, attestation and code of ethics activities, enhancing visibility, decision-making and control. This centralized view allows for quick identification of issues and trends, facilitating timely interventions. Users can obtain a holistic outlook exploring numerous metrices shown on the dashboard view, along with necessary actions for the audits, attestations and code of ethics.
Let us assume that you have already set up your organization. You get redirected to the Dashboard after your firm / organization details are provided.
Here is the view of the Dashboard. This is the default application landing page. It offers data visualization with real-time analytics and facilitates better decision making with the ready visibility of audits, attestations and code of ethics data of your organization.
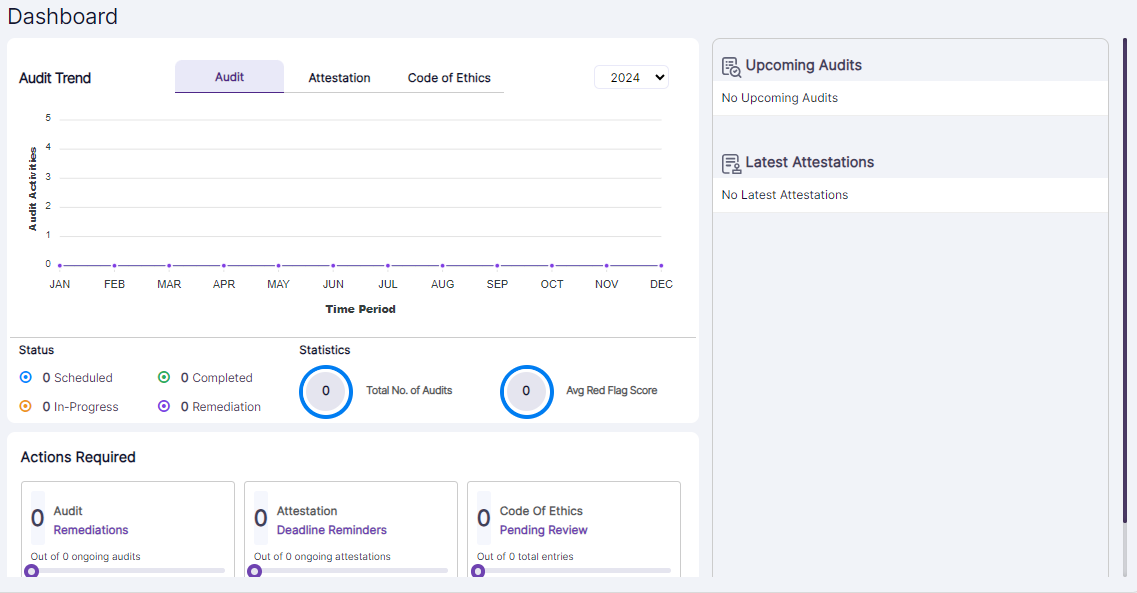
Fig: 1 - Blank Dashboard visible after onboarding
 NOTE: SurgeONE.ai Dashboard page visibility and its tab functionalities / visibilities can vary on the basis of the View Accesses category permissions set for the role the logged-in user belongs to. For additional information, please visit the Roles page.
1.1. Viewing the Dashboard
You can also click on the left panel Dashboard menu to navigate to this page.
1.1.1. Trend
With trend analysis capabilities, users can track how different audits, attestations and code of ethics activities evolve over time, allowing for timely adjustments to strategies. For example, if audits show a consistent pattern of remediations required, management can quickly implement targeted training or resources to address the issue.
Information and statistics pertaining to the audits and attestations of your organization are displayed here. You can toggle between the Audit, Attestation and Code of Ethics trend chart representation using the respective tabs at the top. By default, the Audit tab is selected.
1.1.1.1. Audit Trend
The Audit tab provides users with an intuitive way to monitor audit activities over time. Users can instantly view the corresponding audit dataset in a trend graph that plots activities against time. This visual and stage-based approach offering a clear view of the audit lifecycle helps identify progress and bottlenecks, and supports efficient audit tracking and planning.
The Audit tab should be selected. Hover your mouse pointer over any displayed month, to view the related audits dataset on the trend view. The graph plots the Audit Activities versus the Time Period. There are four different stages that are depicted. They are as follows: Scheduled, In-Progress, Completed, Remediation.

Fig: 2 - Dashboard with Audit dataset visible for the viewed month
1.1.1.2. Attestation Trend
The Attestation tab offers users a streamlined way to track attestation activities over time. Users can instantly view the corresponding dataset in a trend graph that plots attestation activities against the time period. The graph provides a clear visual representation of the attestation process. This interactive and stage-based view supports better monitoring, helps identify trends and gaps, and enhances overall decision-making related to compliance and accountability.
The Attestation tab should be selected. Hover your mouse pointer over any displayed month, to view the related attestations dataset on the trend view. The graph plots the Attestation Activities versus the Time Period. There are four different stages depicted. They are as follows: Created, In-Progress, Completed, Overdue.
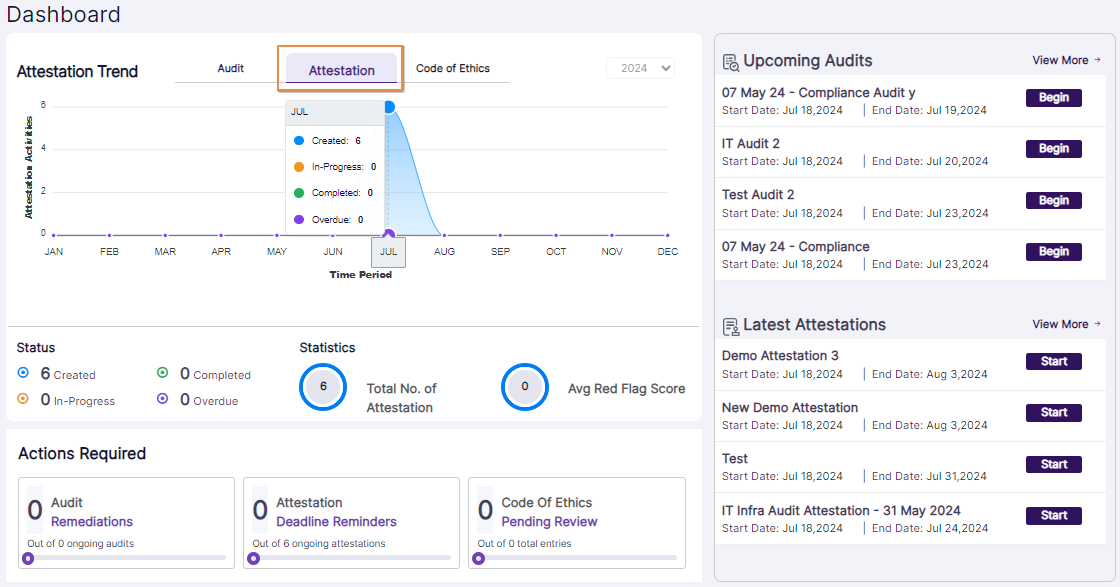
Fig: 3 - Dashboard with Attestation dataset visible for the viewed month
1.1.1.3. Code of Ethics Trend
The Code of Ethics tab enables users to monitor related activities over time through an interactive trend graph. The graph plots Code of Ethics activities against the time period and features six distinct modules, offering a comprehensive view of engagement and compliance. This modular and time-based visualization supports better tracking, highlights participation trends, and aids in identifying areas that may require further attention or action.
The Code of Ethics tab should be selected. Hover your mouse pointer over any displayed month, to view the related attestations dataset on the trend view (provided that data exists for that month). The graph plots the Code of Ethics Activities versus the Time Period. There are six different modules depicted. They are as follows: Securities Trading, Gifts & Entertainment, Political Contributions, Outside Business Activities, Complaints and Outside Accounts.
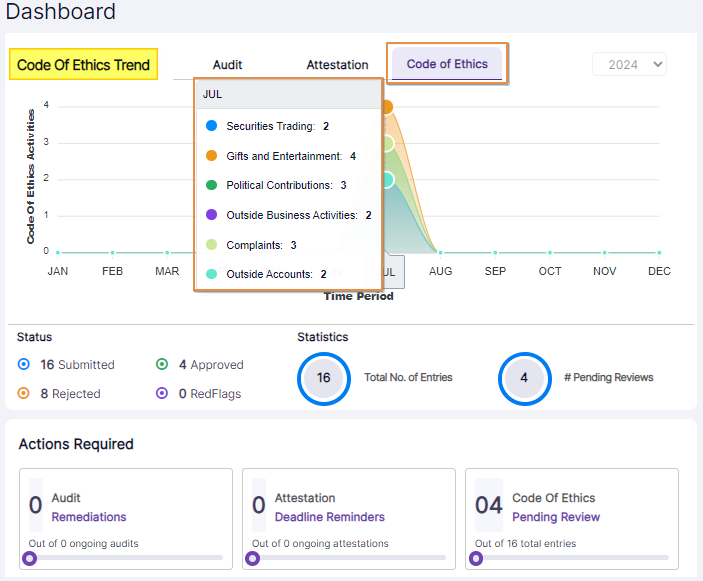 Fig: 4 - Dashboard with Code of Ethics dataset visible for the viewed month
1.1.2. Status
Users can view a status-wise count of items, offering a quick summary of activity distribution. The statuses displayed dynamically change based on the selected top tab, ensuring that the information remains relevant to the context. This feature enhances visibility into the current state of activities and supports more informed monitoring and analysis.
Below the trend depiction, (at the bottom left side) you can find the status wise count of items. The statuses displayed here are dependant on the top tab selected (Audit / Attestation / Code of Ethics).
Let us understand how each of these fields function for the three tabs.
1.1.2.1. Audits tab selection
- Scheduled: It denotes the count of the audits which are created, but are yet to be started.
- Completed: It denotes the count of the audits which are completed.
- In-Progress: It denotes the count of the audits which are being processed. These audits are started but are yet to be submitted.
- Remediation: It denotes the count of the audits which are needing remediation. These audits are having red flagged response(s) which need to be resolved, prior to audit completion.
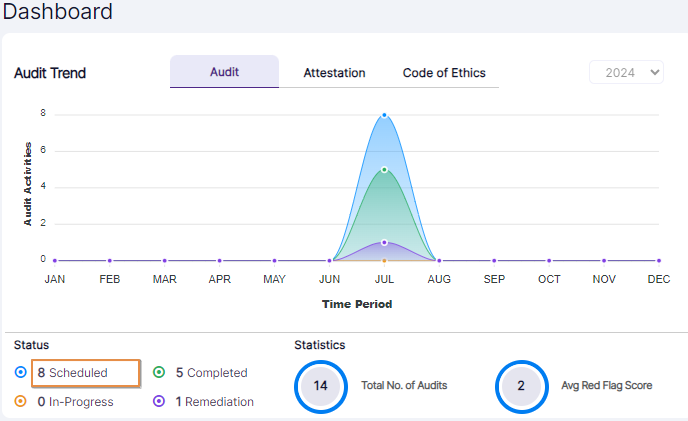 Fig: 5 - Scheduled status field
You can click on the field to load the Scheduled Audit Reports for the selected year. Here is the report view.
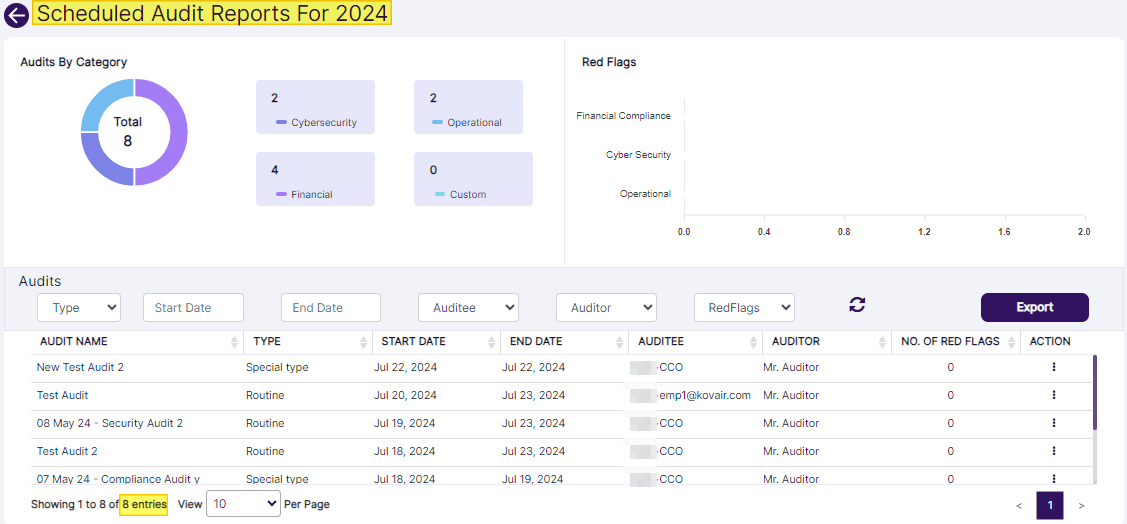 Fig: 6 - Scheduled Audit Reports view
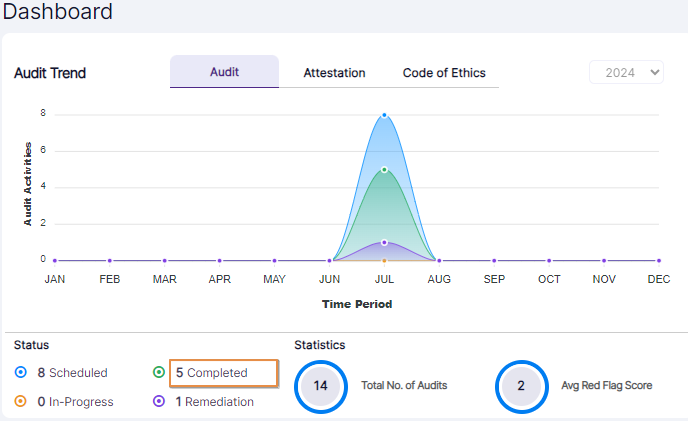 Fig: 7 - Completed status field
You can click on the field to load the Completed Audit Reports for the selected year. Here is the report view.
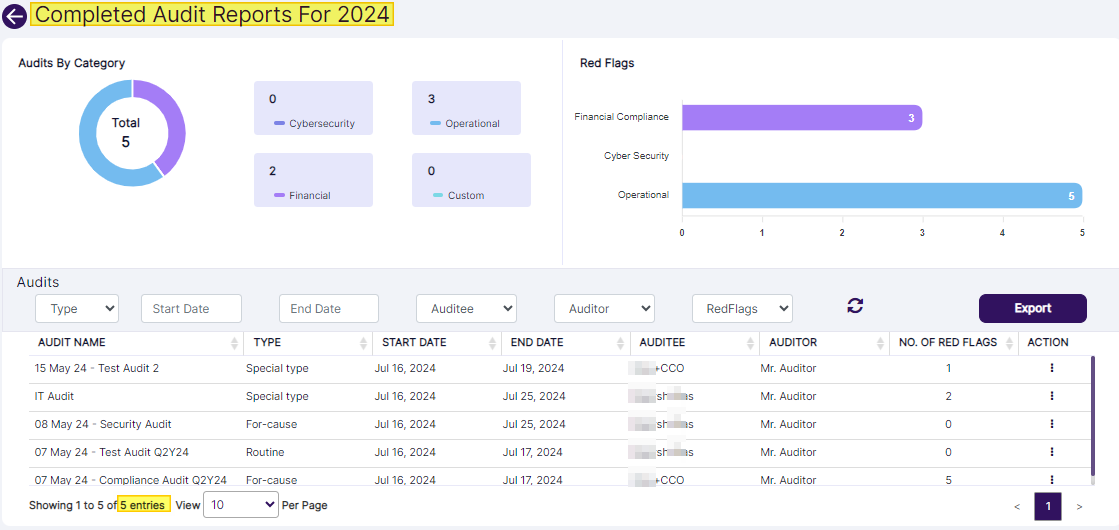 Fig: 8 - Completed Audit Reports view
 Fig: 9 - In-Progress status field
You can click on the field to load the In-Progress Audit Reports for the selected year. Here is the report view.
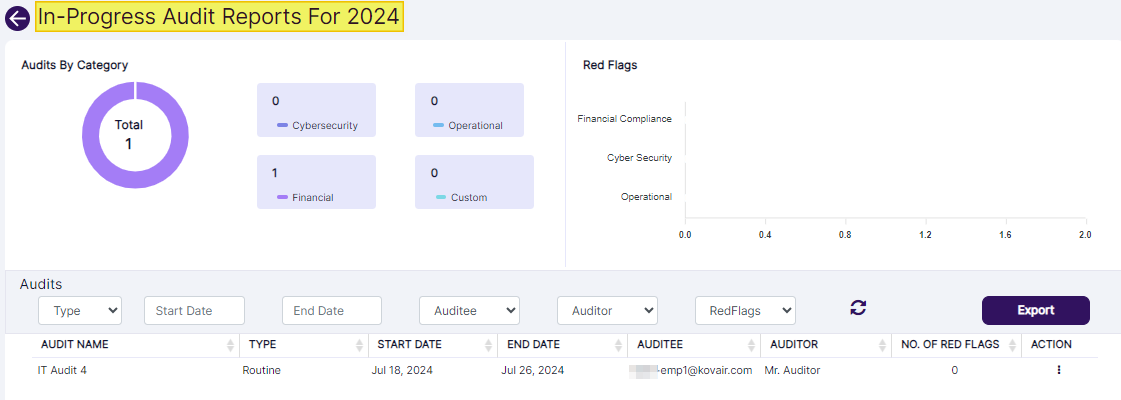 Fig: 10 - In-Progress Audit Reports view
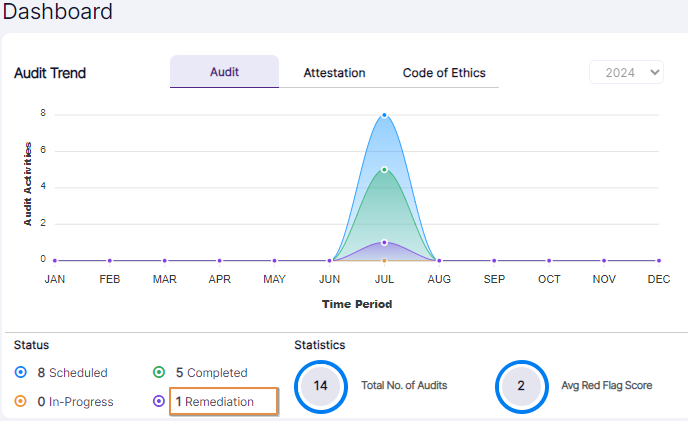 Fig: 11 - Remediation status field
You can click on the field to load the Remediation Audit Reports for the selected year. Here is the report view.
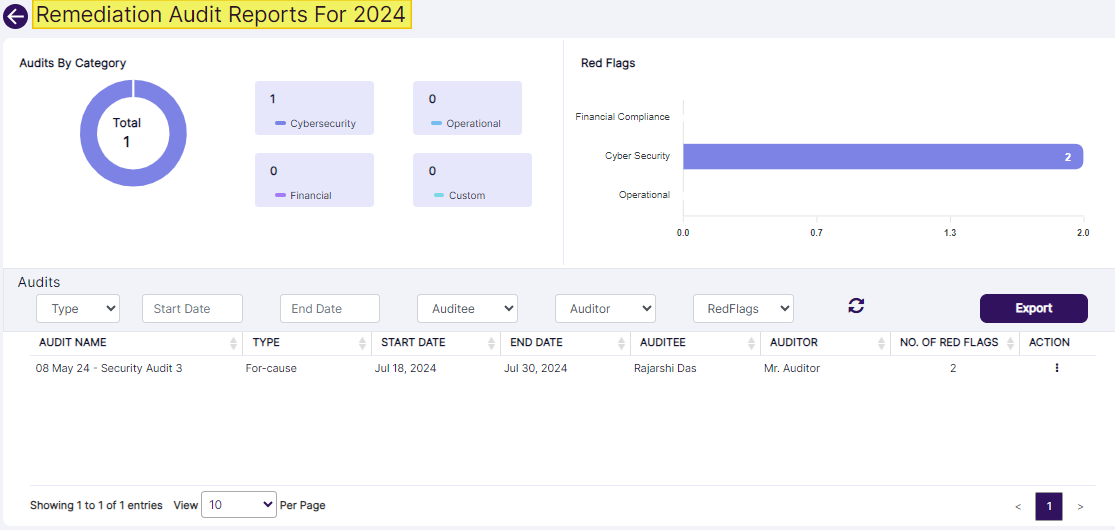 Fig: 12 - Remediation Audit Reports view
NOTE:
- The count displayed on the Dashboard usually (depending whether the logged-in user is the assigned user) matches with the audit status-wise report items count.
- If the count displayed on any status on the Dashboard is zero, then no action occurs on clicking on that status field.
- Since the Scheduled Audit Report shows the entries which are yet to be started, the Red Flags section is blank.
- Audits can be seen by the permitted user.
- You can set report filters, export report results (using the Export button), or view the audit details (using the hamburger icon of the ACTION column).
- There is a drill down feature in the Audits by Category donut chart and Red Flags bar chart in the status reports for Audits. Here is a view of the Remediation Audit Reports, showing four grid view entries, which correspond with the total of 4 entries present, as denoted by the donut chart.
- Click on any color coded category of the Audits by Category donut chart to load only the corresponding entries. For example, clicking on the Cyber Security category (section of the donut chart) loads only those category audits in the grid view. Refer to the following screenshot.
- Similarly, click on any color coded category of the Red Flags bar chart to load only the corresponding entries. For example, clicking on the Cyber Security category (section of the bar chart) loads only those category audits in the grid view. Refer to the following screenshot.
- This functionality is applicable for other reports based on the status of the audits.
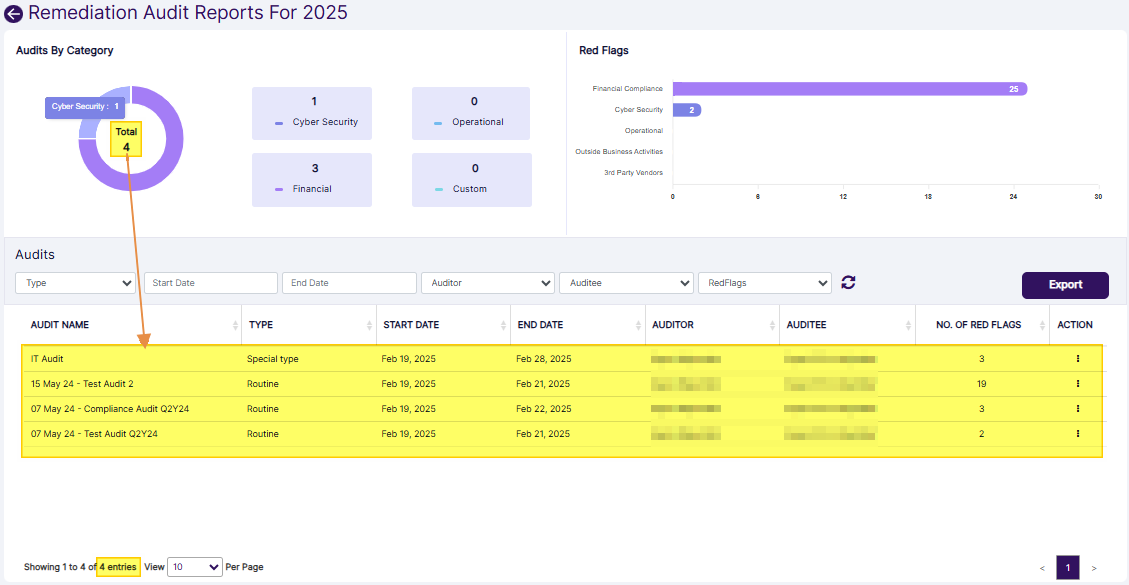 Fig: 13 - Remediation Audit Reports view
 Fig: 14 - Filtered entries as per Audtis by Category selection
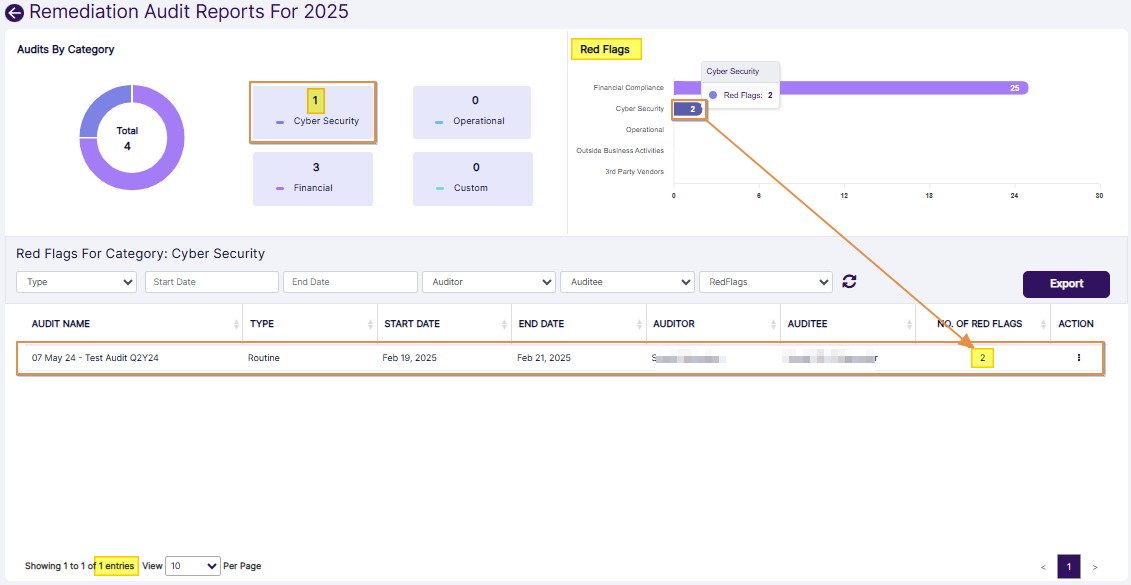 Fig: 15 - Filtered entries as per Red Flags category selection
1.1.2.2. Attestation tab selection
- Created: It denotes the count of the attestations which are created, but are yet to be started.
- Completed: It denotes the count of the attestations which are completed.
- In-Progress: It denotes the count of the attestations which are being processed (where the attestation status can be either In Progress or Need Remediation or Remediation In Progress). These attestations are started but are yet to be remediated.
- Overdue: It denotes the count of the attestations which are overdue. Overdue attestations are the ones which are created and yet to be started, where the End Date value is past-dated with respect to the current date (attestation due date is crossed).
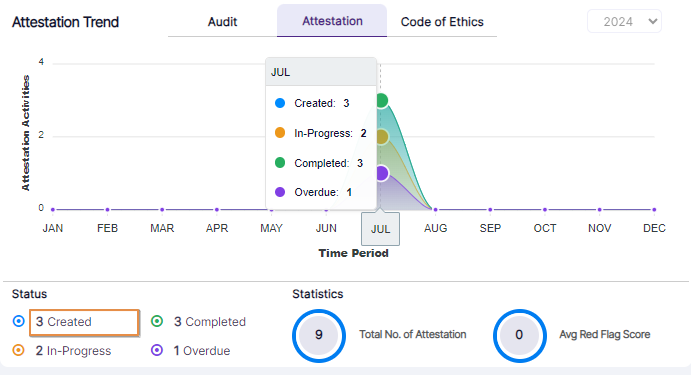 Fig: 16 - Created status field
You can click on the field to load the Created Attestation Reports for the selected year. Here is the report view.
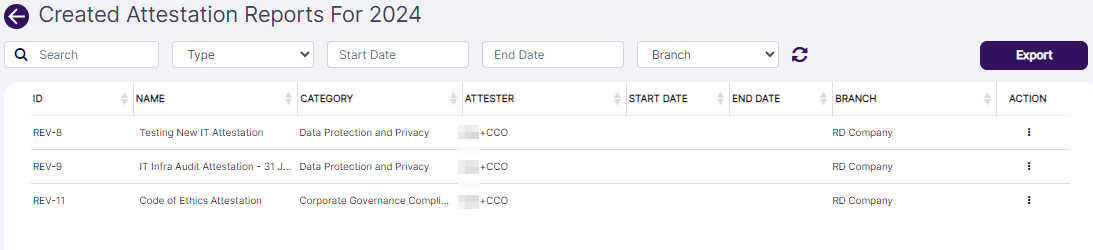 Fig: 17 - Created Attestation Reports view
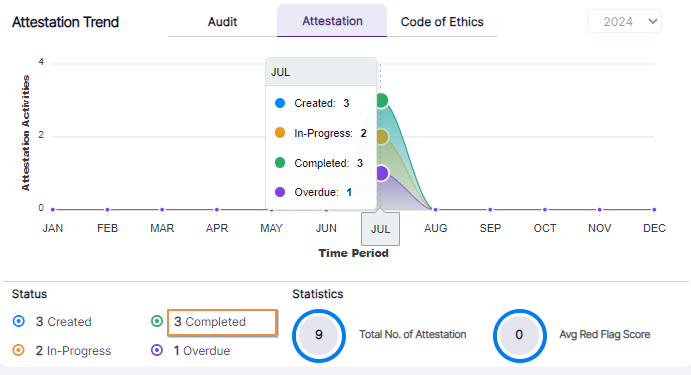 Fig: 18 - Completed status field
You can click on the field to load the Completed Attestation Reports for the selected year. Here is the report view.
 Fig: 19 - Completed Attestation Reports view
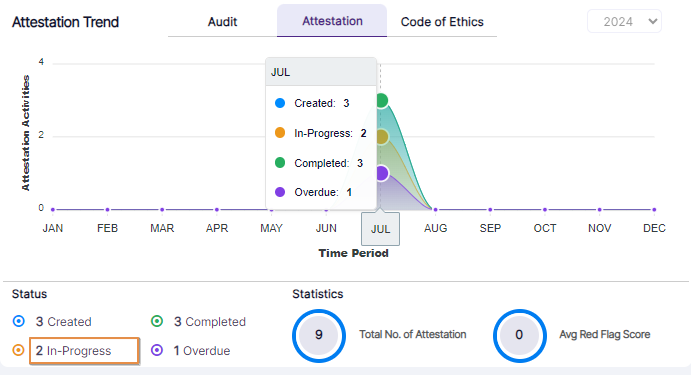 Fig: 20 - In-Progress status field
You can click on the field to load the In-Progress Attestation Reports for the selected year. Here is the report view.
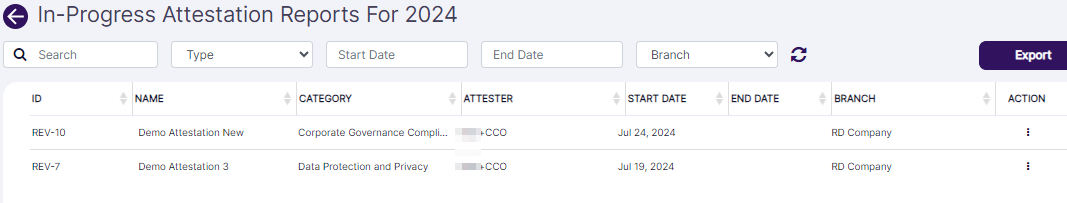 Fig: 21 - In-Progress Attestation Reports view
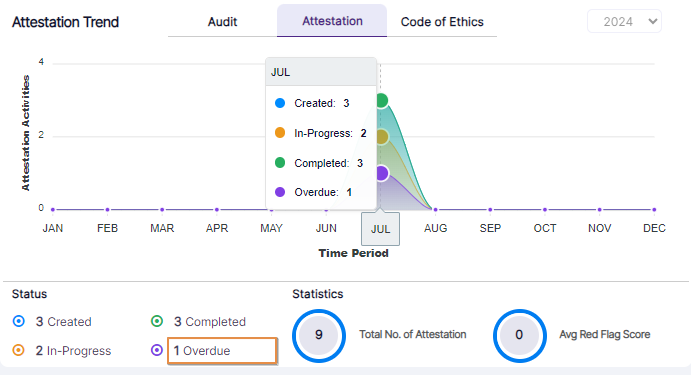 Fig: 22 - Overdue status field
You can click on the field to load the Overdue Attestation Reports for the selected year. Here is the report view.
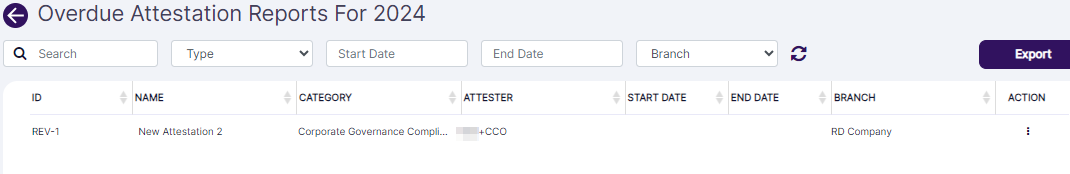 Fig: 23 - Overdue Attestation Reports view
NOTE:
- The count displayed on the Dashboard usually (depending whether the logged-in user is the assigned user) matches with the attestations status-wise report items count.
- If the count displayed on any status on the Dashboard is zero, then no action occurs on clicking on that status field.
- The visibility of the count displayed on the status fields, and the report entries which populate the grid view, are both dependant on the user permissions.
- If the logged-in user is not the employee assigned to an attestation, then that attestation will not reflect upon the count on Dashboard or on the respective status-wise report. In that case, the report will not display the unassigned attestation as a report result in the grid view.
- You can set report filters or export report results (using the Export button).
1.1.2.3. Code of Ethics tab selection
- Submitted: It denotes the count of the submitted entries in the six modules of Code of Ethics.
- Approved: It denotes the count of the entries in the six modules of Code of Ethics which have been approved (thus having the Approved status).
- Rejected: It denotes the count of the entries in the six modules of Code of Ethics which have the Rejected status.
- RedFlags: It denotes the count of the Code of Ethics entries which are red flagged .
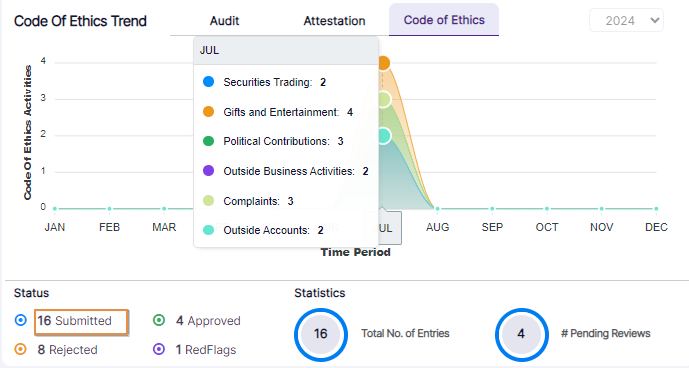 Fig: 24 - Submitted status field
You can click on the field to load the Submitted Code of Ethics Reports for the selected year. Here is the report view.
 Fig: 25 - Submitted Code of Ethics Reports view
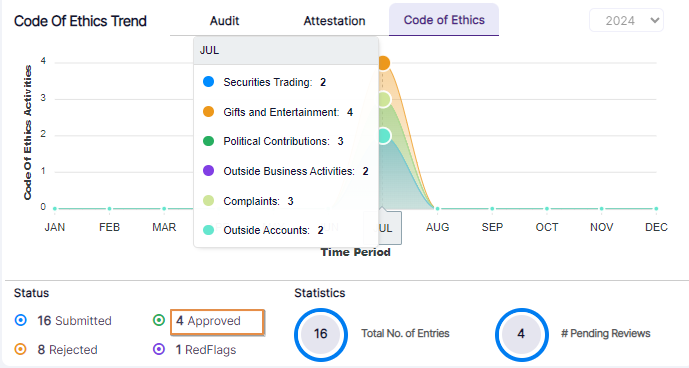 Fig: 26 - Approved status field
You can click on the field to load the Approved Code of Ethics Reports for the selected year. Here is the report view.
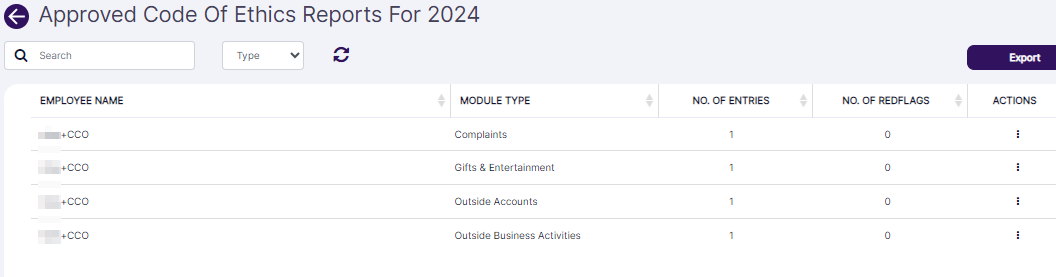 Fig: 27 - Approved Code of Ethics Reports view
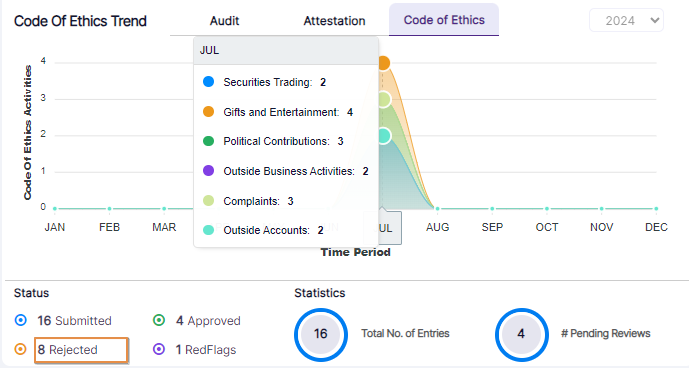 Fig: 28 - Rejected status field
You can click on the field to load the Rejected Code of Ethics Reports for the selected year. Here is the report view.
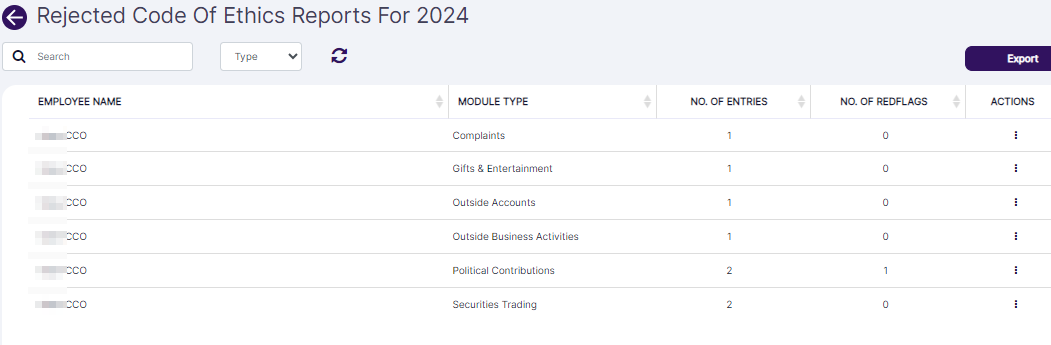 Fig: 29 - Rejected Code of Ethics Reports view
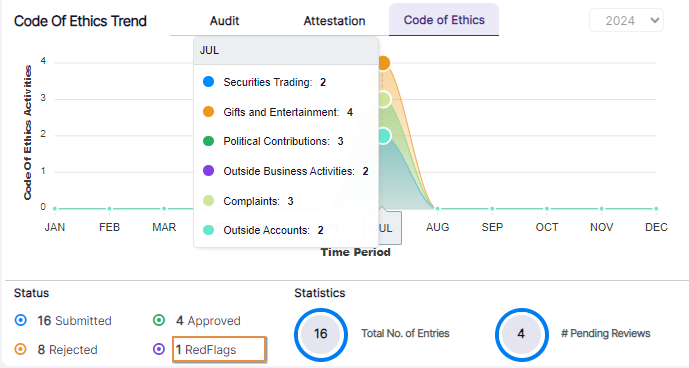 Fig: 30 - Overdue status field
You can click on the field to load the RedFlags Code Of Ethics Reports for the selected year. Here is the report view.
 Fig: 31 - RedFlags Code Of Ethics Reports view
NOTE:
- The count displayed on the Dashboard usually (depending whether the logged-in user has created Code of Ethics entry) matches with the Code of Ethics status-wise report items count.
- If the count displayed on any status on the Dashboard is zero, then no action occurs on clicking on that status field.
- A user can view, approve and reject Code of ethics requests depending to the set permissions.
- You can set report filters or export report results (using the Export button).
1.1.3. Statistics and Actions Required
Users can also view key summary metrics which provide a quick snapshot of overall activity and potential areas of concern, helping users prioritize follow-ups and maintain oversight across audits, attestations, or Code of Ethics modules.
Below the trend depiction, you can also find the total count of entries, average red flags count, count of actions required on items, etc.
Let us understand how some of these fields are calculated in the system.
1. Statistics
- Audit Avg Red Flag Score: (Per Audit total Red Flag) / (Total number of Audits)
- Attestation Avg Red Flag Score: (Per Attestation total Red Flag) / (Total number of Attestations)
- Code of Ethics # Pending Reviews: (Total No. of Entries) - [(Approved) + (Rejected)]
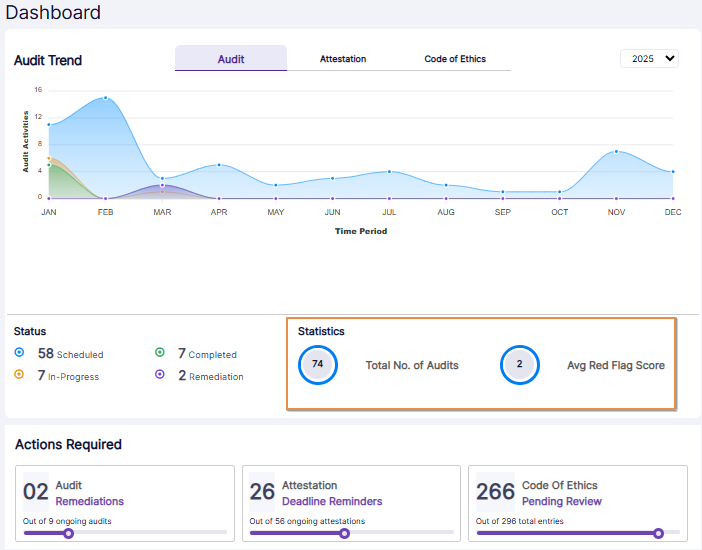 Fig: 32 - Statistics section view of the Audit tab
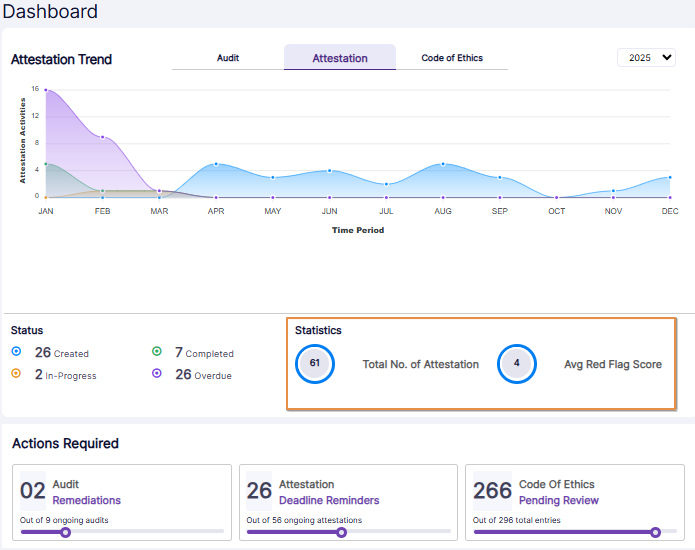 Fig: 33 - Statistics section view of the Attestation tab
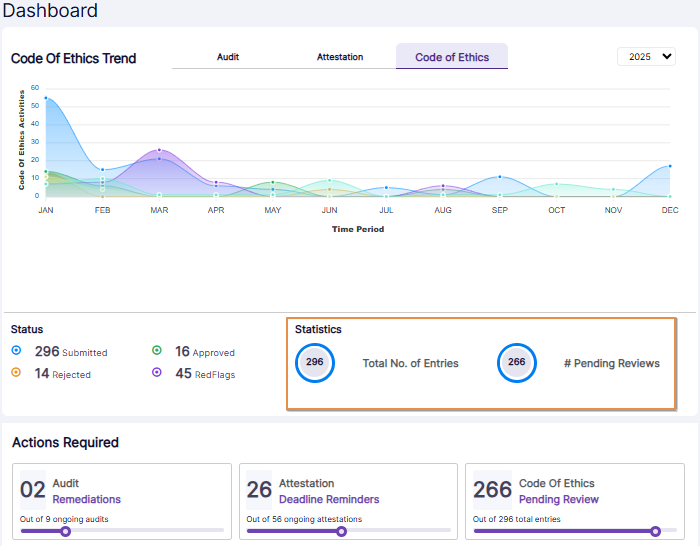 Fig: 34 - Statistics section view of the Code of Ethics tab
2. Actions Required
- Audit Remediations (Out of <N> ongoing audits): [(Audits having status: Need Remediation) + (Audits having status: Remediation in Progress)] / (Audits having status: Remediation) + (Audits having status: In Progress)].
- Attestation Deadline Reminders (Out of <N> ongoing attestations): [(Overdue Attestations) / (In Progress Attestations) + (Need Remediation Attestations) + (Overdue Attestations) + (Remediation in Progress Attestations)]
- Code Of Ethics Pending Review (Out of <N> total entries): [(Total number of created entries) - (Total number of approved entries) - (Total number of rejected entries)]
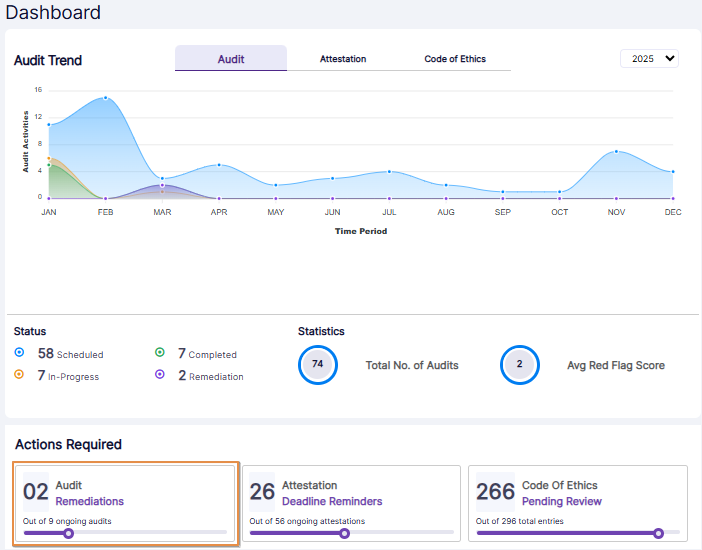 Fig: 35 - Actions Required section view of the Audit tab
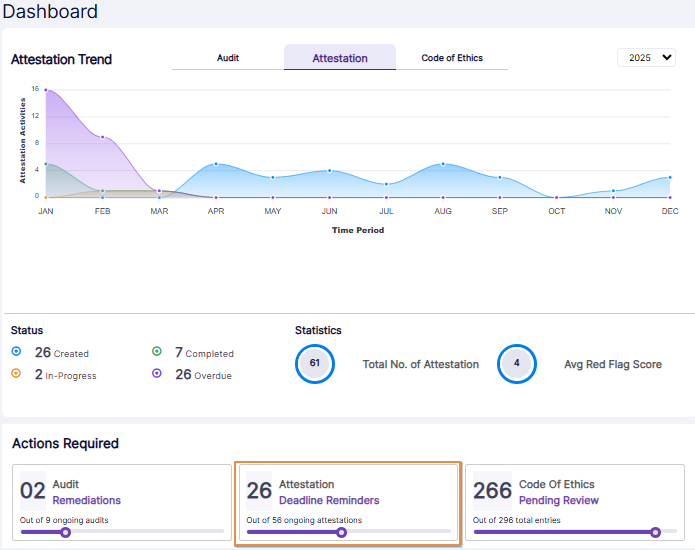 Fig: 36 - Actions Required section view of the Attestation tab
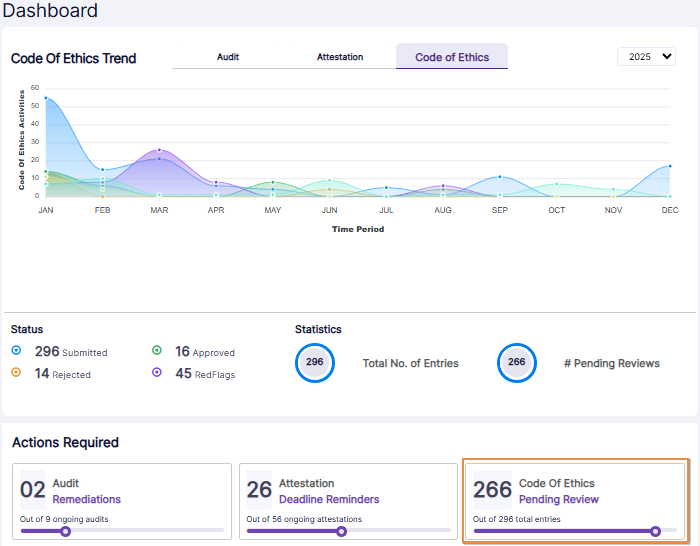 Fig: 37 - Actions Required section view of the Code of Ethics tab
1.1.4. Upcoming Audits and Latest Attestations
The right-side panel serves as a real-time activity tracker, allowing users to quickly understand what is scheduled and what has recently occurred. A particularly useful feature is the context-sensitive action button that appears next to upcoming audits. This button is displayed based on specific conditions, such as whether the user is assigned to the audit or if the audit is approaching its start date - enabling users to take immediate action when relevant. This dynamic functionality ensures that users are not only kept informed but are also empowered to respond proactively, improving task management and accountability. Overall, this panel enhances visibility, supports timely engagement, and helps users stay organized by surfacing the most relevant and actionable items in a single, accessible location.
On the right-side panel, you can view the upcoming audits and latest attestations. Here, the name of the audit/attestation, its start and end dates are displayed. You can notice (depending on various conditions such as assigned user or start date) an action button against the Upcoming Audits (for example Begin) and Latest Attestations (for example Start).
 Fig: 38 - Action button on Dashboard
NOTE:
- This action button is visible to the assigned user(s) to initiate the audit or attestation. Use it to directly process the audit or attestation instead of having to visit the respective Audits or Attestations page first.
- Upcoming Audits and Latest Attestations are based on the audit/attestation status and the audit/attestation end date.
 Fig: 39 - Chronological sorting of Audits and Attestations on the Dashboard
2. Using the top right Panel
You can find there are multiple icons provided in the top right panel (to the right of the organization name).
Page Context Help
The first one is the question mark  icon. Click on it to load the page context help.
Online user guides presented as page context help files provide immediate, relevant assistance directly within the user interface. This integration allows users to access instructions and troubleshooting tips without leaving their current task, improving efficiency and reducing frustration. Periodic real-time updates to the online helps ensure users receive the most current information, enhancing modular understanding and user satisfaction. Ultimately, these help files empower users to make the most of a product, boosting productivity and overall experience.
Notifications Panel
Next to the question mark icon is the notifications  icon. Click on it to slide out a panel that lists out various application notifications (as received).
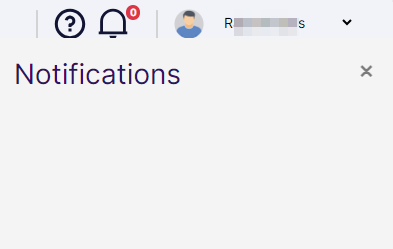 Fig: 40 - Expanded blank notification panel
Click on the cross  icon to close this expanded panel. Alternatively, you can click again on the notification icon to close the expanded panel.
Notice that at the top right of the notification icon is a numeric value, which denotes the count of the received notifications.
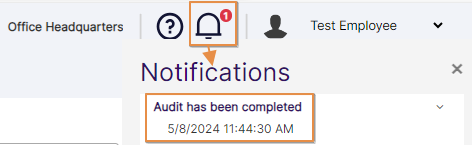 Fig: 41 - One notification visible in the notification panel
You can expand the message using the down arrow  icon.
icon.
 Fig: 42 - Expanded notification view
Notifications get stacked up in the panel if there are multiple instances of generation in the application.
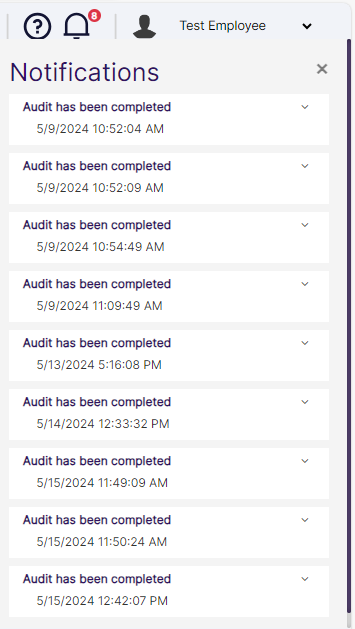 Fig: 43 - Multiple notifications stacked up on the notification panel
User Profile Menu
The third option is the user profile picture preview and the logged-in username. Click on the down arrow icon beside the name to load the user account context menu.
The intuitive layout of this menu allows quick access to essential functions without disrupting workflow. Transparency is achieved by allowing users to see which version of the software they are using, facilitating effective communication about features and potential issues with support teams. The option to upload a profile picture fosters engagement and a sense of community among the users, especially in collaborative environments. An easy logout feature ensures account security, especially in shared environments.
1. About SurgeONE
Click on the About SurgeONE menu option.
 Fig: 44 - User menu expanded view showing the About SurgeONE menu option
The application debug and release versions can be seen. Click on cross icon to close this view.
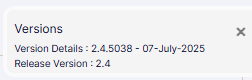 Fig: 45 - SurgeONE.ai application debug and release versions displayed after clicking on the About SurgeONE menu option
2. Logout
Click on Logout option to terminate your logged in session and get redirected to the application login page. You need to login to re-access the application.
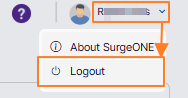 Fig: 46 - User menu expanded view showing the Logout button
2.1. Uploading Profile Picture
You have the option to upload your own profile picture. Once uploaded, it is visible in the profile picture preview. This is visible in the top right panel of the application across all screens.
Click on the profile picture preview to load the Upload Profile Picture dialog box.
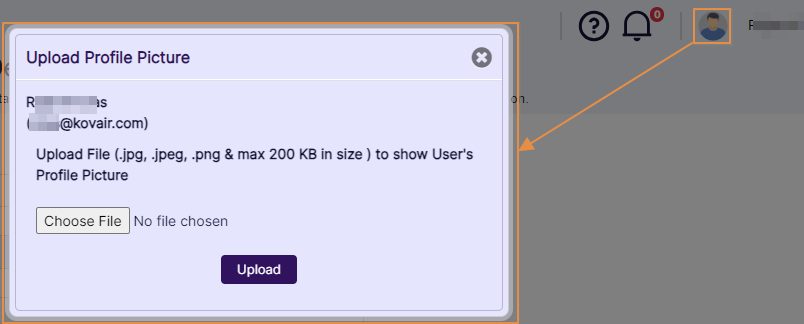 Fig: 47 - Upload Profile Picture dialog box
Click on the Choose File button to browse and select a suitable image. Before the image is selected, a placeholder label No file chosen is visible next to this button.
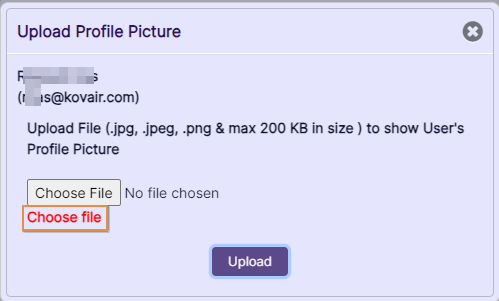 Fig: 48 - Choose File button
After you select an image file, the filename can be seen in its place. You can click on the red cross  icon to remove the selected image.
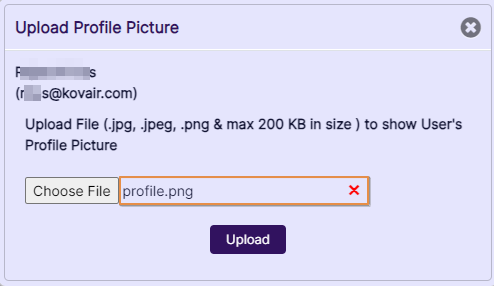 Fig: 49 - Chosen image filename visible
Click on the Upload button to set the selected image as your profile picture.
 Fig: 50 - Upload button to set profile picture
You can view the uploaded image displayed in your profile picture preview.
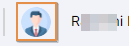 Fig: 51 - Uploaded image visible in UI